Option Strategy Payoff Diagram Tool
Option Strategy Payoff Diagram Tool: Visualize Your Trading Strategies
Welcome to our Option Strategy Payoff Diagram Tool, designed for traders, investors, and financial enthusiasts who want to visualize and analyze the potential payoffs of various options strategies. Understanding the risk and reward of each option strategy is crucial in making informed investment decisions, and our tool simplifies this process.
What is an Option Payoff Diagram?
An option payoff diagram illustrates the potential outcomes of an options trade at expiration. It visually represents the relationship between the underlying asset's price and the profit or loss you may incur from your chosen options strategy. By using this tool, you can easily see how different factors like strike prices and premiums affect your overall payoff.
Why Use the Option Strategy Payoff Diagram Tool?
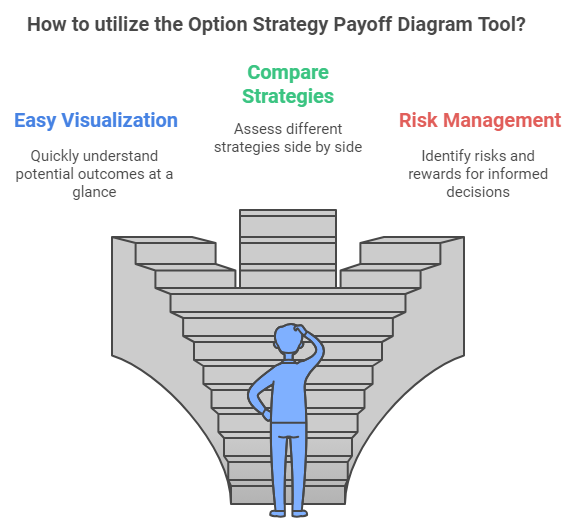
Our Option Strategy Payoff Diagram Tool offers several key benefits:
- Easy Visualization: Quickly generate payoff diagrams for various options strategies, allowing you to understand potential outcomes at a glance.
- Compare Strategies: Assess different options strategies side by side, helping you choose the best approach based on your market outlook.
- Risk Management: Identify potential risks and rewards, enabling you to make more informed decisions and manage your investment portfolio effectively.
- Educational Resource: Perfect for beginners looking to learn about options trading, our tool provides a hands-on experience in understanding options strategies.
How to Use the Option Strategy Payoff Diagram Tool
Using our tool is simple and intuitive:
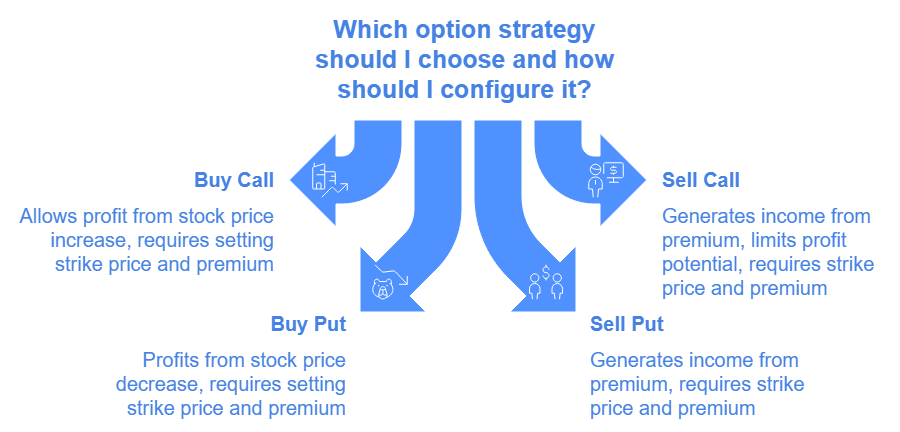
- Select Your Option Strategy:
Choose from popular strategies like Buy Call, Sell Call, Buy Put, Sell Put, Bull Call Spread, or Bear Put Spread. - Enter Strike Price ($):
Specify the strike price for your options. This is crucial for determining your potential payoffs. - Input Premium Paid/Received ($):
Enter the premium amount associated with the chosen strategy. This will influence your overall profit or loss. - Set Stock Price Range:
Define the minimum and maximum stock prices to visualize how your payoff changes across a range of potential stock prices. - Generate Payoff Diagram:
Click the “Generate Payoff Diagram” button to visualize your chosen strategy's potential outcomes. The diagram will illustrate how your profit or loss evolves as the underlying stock price changes.
Understanding Your Payoff Diagram
After generating the payoff diagram, you will see:
- X-Axis: Represents the stock price at expiration.
- Y-Axis: Displays the potential payoff (profit or loss) for your selected options strategy.
- Curve Line: The line representing the payoff indicates how your profit or loss changes based on the stock price.
With this visual aid, you can better assess how each strategy reacts under various market conditions.
Maximize Your Trading Insights with the Option Strategy Payoff Diagram Tool
Our Option Strategy Payoff Diagram Tool is your go-to resource for evaluating and visualizing options trading strategies. By understanding the potential payoffs, you can confidently make informed trading decisions and improve your financial outcomes.
Get Started Today!
Don’t miss out on the opportunity to refine your options trading skills. Use our Option Strategy Payoff Diagram Tool to explore various strategies and gain insights into your trading approach. Start generating your payoff diagrams now and take a step towards smarter investing!
Frequently Asked Questions (FAQ)
The Option Strategy Payoff Diagram Tool allows users to visualize the potential payoffs of various options trading strategies based on different stock prices.
To use the tool, select an option strategy, enter the strike price, premium, and stock price range, then click "Generate Payoff Diagram" to see the results.
You can choose from several strategies including Buy Call, Sell Call, Buy Put, Sell Put, Bull Call Spread, and Bear Put Spread.
You need to provide the option strategy, strike price, premium paid/received, and the stock price range (minimum and maximum).
The payoff diagram represents the potential profit or loss for a given options strategy at different stock prices, helping traders make informed decisions.
Yes, the Option Strategy Payoff Diagram Tool is completely free to use and provides a valuable resource for options traders.